My Cart
No products in the cart.
Free Shipping In The US!
100% Secure Checkout.
Rising Sea Levels
Gabrielle Mérite x Kat Kat
A two-part collaboration brought to you by Gabrielle Mérite and Kat Kat. This project was released on Earth Day and calls attention to the continuing issue of rising sea levels.
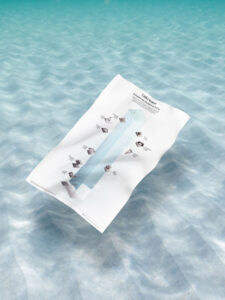
The topic of rising sea levels is explored through the pairing of a print and earring. While the print and earrings are tied together in topic and aesthetic, they address the issue at different levels. The earrings paint the big picture while the print dives into the details to relay why this matters.
How Much Has Global Sea Level Risen?
Earring Design
Over the past 15 years, global mean sea level has risen 54 mm. These earrings illustrate this increase from 2006 to 2020.
Each column of beads represents a single year. Each bead represents a measurement of 1 mm. White beads indicate increases while gray beads indicate decreases in each of these years. From left to right, we can see how much global mean sea level has risen over time with the growing blue-green wave.
Significant periods of increase occur during the years 2012, 2013, and 2016. In 2013, the daily mean concentration of CO2 surpassed 400 ppm as reported by the Mauna Loa Observatory in Hawaii. A first since recording began in 1958.
Hover over the ‘+’ icons in the image for more details.
Legend
Increase in Global Mean Sea Level
White Beads
Decrease in Global Mean Sea Level
Gray Beads
Why Does this Matter?
Print Design
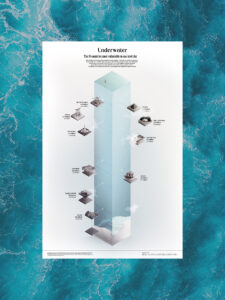
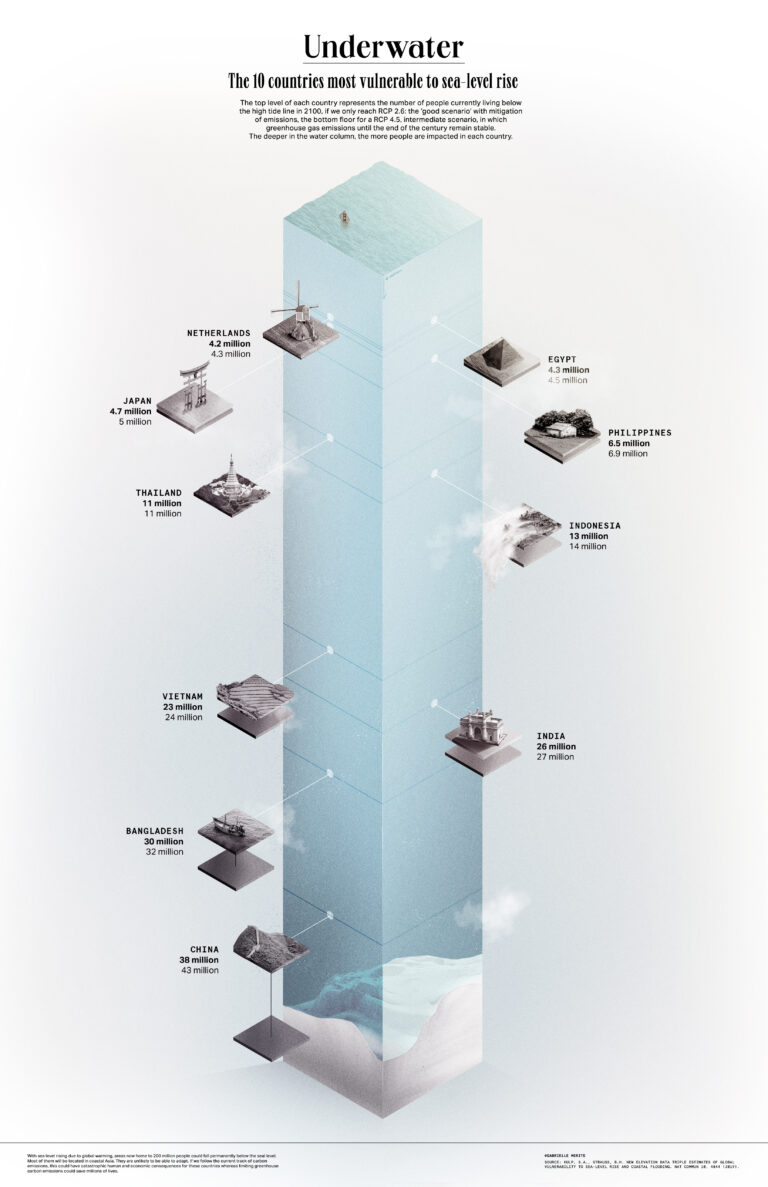
The print dives into the details and answers the question of what the impact is on humans: how many people will end up below sea level? Who is the most vulnerable? Can our action change their fate?
The poster allows us to understand in part why rising sea level matters. Each island floating represents one of the 10 countries the most affected by the sea-level rise. The extent to which these islands are located vertically symbolizes the millions of people from these countries that will also be underwater. If countries continue to produce greenhouse gas following the same trajectory (RCP 4.5), homes of now more than 200 million people could fall permanently below the high tide line by 2100. By limiting our gas emissions (RCP 2.6), we could save millions of lives from floods and countries from catastrophic human and economic consequences.
This poster is also a reminder that our developed countries probably won’t be the most impacted by the climate crisis. The most vulnerable and least responsible for it will be.
Order your set today
Sources
1) Earring data source can be found here. HDR GSFC. 2020. Global Mean Sea Level Trend from Integrated Multi-Mission Ocean Altimeters TOPEX/Poseidon, Jason-1, OSTM/Jason-2, and Jason-3. Version 5.0 Ver. 5.0 PO.DAAC CA, USA. Dataset accessed 2021-03-02.
2) A Brief History of Climate Change
3) Kulp, S.A., Strauss, B.H. New elevation data triple estimates of global vulnerability to sea-level rise and coastal flooding. Nat Commun 10, 4844 (2019).
Donation
5% of profits from your purchase will be donated to the Urban Ocean Lab.
Donation
5% of profits from your purchase will be donated to the Urban Ocean Lab.
Order your set today
More Data, More Jewelry
Previous slide
Next slide


